Code
library(ggplot2)Warning: package 'ggplot2' was built under R version 4.4.1Code
library(readr)Warning: package 'readr' was built under R version 4.4.1Code
library(naniar)Warning: package 'naniar' was built under R version 4.4.2Identify one or more data sources (see II. D. above) that you propose to draw on for the project. For each, describe how the data are collected and by whom. Describe the format of the data, the frequency of updates, dimensions, and any other relevant information. Note any issues / problems with the data, either known or that you discover. Explain how you plan to import the data. Carefully document your sources with links to the precise data sources that you used. If that is not possible (for example if your data is not available online, then explain that clearly.) (suggested: 1/2 page)
There are two datasets, amazon_purchases.csv and survey.csv, from the Harvard paper, “Open e-commerce 1.0: Five years of crowdsourced U.S. Amazon purchase histories with user demographics.” The first dataset was a longitudinal collection of purchase data from 5027 Amazon.com users recruited from the online research platforms, Prolific and CloudResearch. If the user decided to share their data with the Harvard researchers, the data was included in the amazon_purchases.csv dataset. If the user then chose to answer an additional survey about their demographics and additional questions, they were compensated for their participation in this study. All participants had to be 18 years or older, U.S. resident and English speaker, and have an active Amazon account. The data collectors were researchers Alex Berke, Robert Mahari, Sandy Pentland, Kent Larson, and Dana Calacci, affiliated with Harvard, MIT and Penn State. This was a one time study so the data collection is finalized so there are not any updates.
The amazon_purchases dataset is a csv file with 1048576 rows and 7 columns while the survey dataset is 5028 rows and 23 columns. There is a common column of participant id, so we will join the two datasets together to get the full picture of the participant’s amazon purchases and survey responses, which will result in a dataset with a total of 1048576 rows and 30 columns. There is missing data for some of the shipping locations, item names (title) etc. which we will have to decide how to deal with that. However, for one of the survey questions there are blank responses to represent non applicable, so we need to distinguish this difference somehow.
We will import the data by downloading the csv that was included in the paper. We also have access to their github in case that is useful.
We decided to look at the missing values for the datasets separately for this step before joining them for data analysis later on.
Imports
library(ggplot2)Warning: package 'ggplot2' was built under R version 4.4.1library(readr)Warning: package 'readr' was built under R version 4.4.1library(naniar)Warning: package 'naniar' was built under R version 4.4.2Load the amazon purchases data into a dataframe
amazon_purchases <- read_csv("data/amazon-purchases.csv")Rows: 1850717 Columns: 8
── Column specification ────────────────────────────────────────────────────────
Delimiter: ","
chr (5): Shipping Address State, Title, ASIN/ISBN (Product Code), Category,...
dbl (2): Purchase Price Per Unit, Quantity
date (1): Order Date
ℹ Use `spec()` to retrieve the full column specification for this data.
ℹ Specify the column types or set `show_col_types = FALSE` to quiet this message.options(readr.show_col_types = FALSE)See how many missing values there are in each column
print("Missing values:")[1] "Missing values:"missing_values = colSums(is.na(amazon_purchases))
print(missing_values) Order Date Purchase Price Per Unit Quantity
0 0 0
Shipping Address State Title ASIN/ISBN (Product Code)
87812 89740 973
Category Survey ResponseID
89458 0 Graph the missing values using the naniar package’s vis_miss function
vis_miss(amazon_purchases, warn_large_data = FALSE)  +
  labs(
    title = "Missing Data Visualization for Amazon Purchase Columns",
    x = "Columns",
    y = "Observations"
  )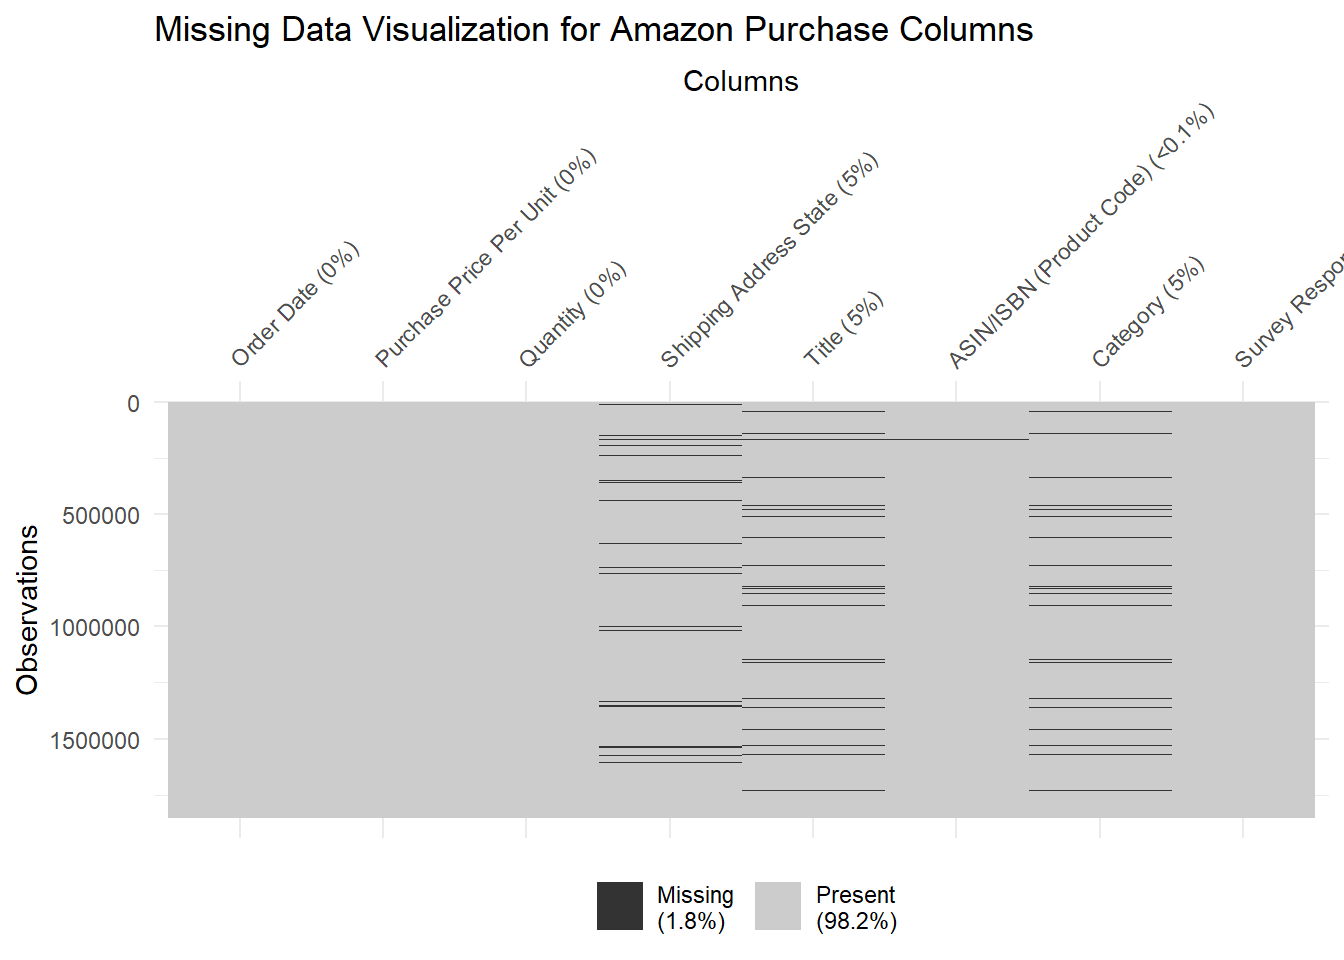
We chose this graph to show the patterns in the missing values in each of the columns. We noticed that observations that had one column value missing did not necessarily have missing values in other columns. There didn’t seem to be a lot of overlap, and the missing values seemed to be random and have no pattern. Shipping address state, title, and category had about 5% of their data values missing, while ASIN/ISBN had less than 0.1% missing values.
Graph the missing values as a simple bar graph to compare which columns have the most missing values
missing = setNames(nm=c('colnames', 'missing'),stack(colSums(is.na(amazon_purchases)))[2:1])

ggplot(missing, aes(x=colnames, y=missing)) + geom_bar(stat="identity") +ggtitle("Distribution of Missing Values by Column Name for Amazon Purchases") + theme(axis.text.x = element_text(angle = 45, hjust = 1)) + xlab("Columns") + ylab("Number of Missing Values")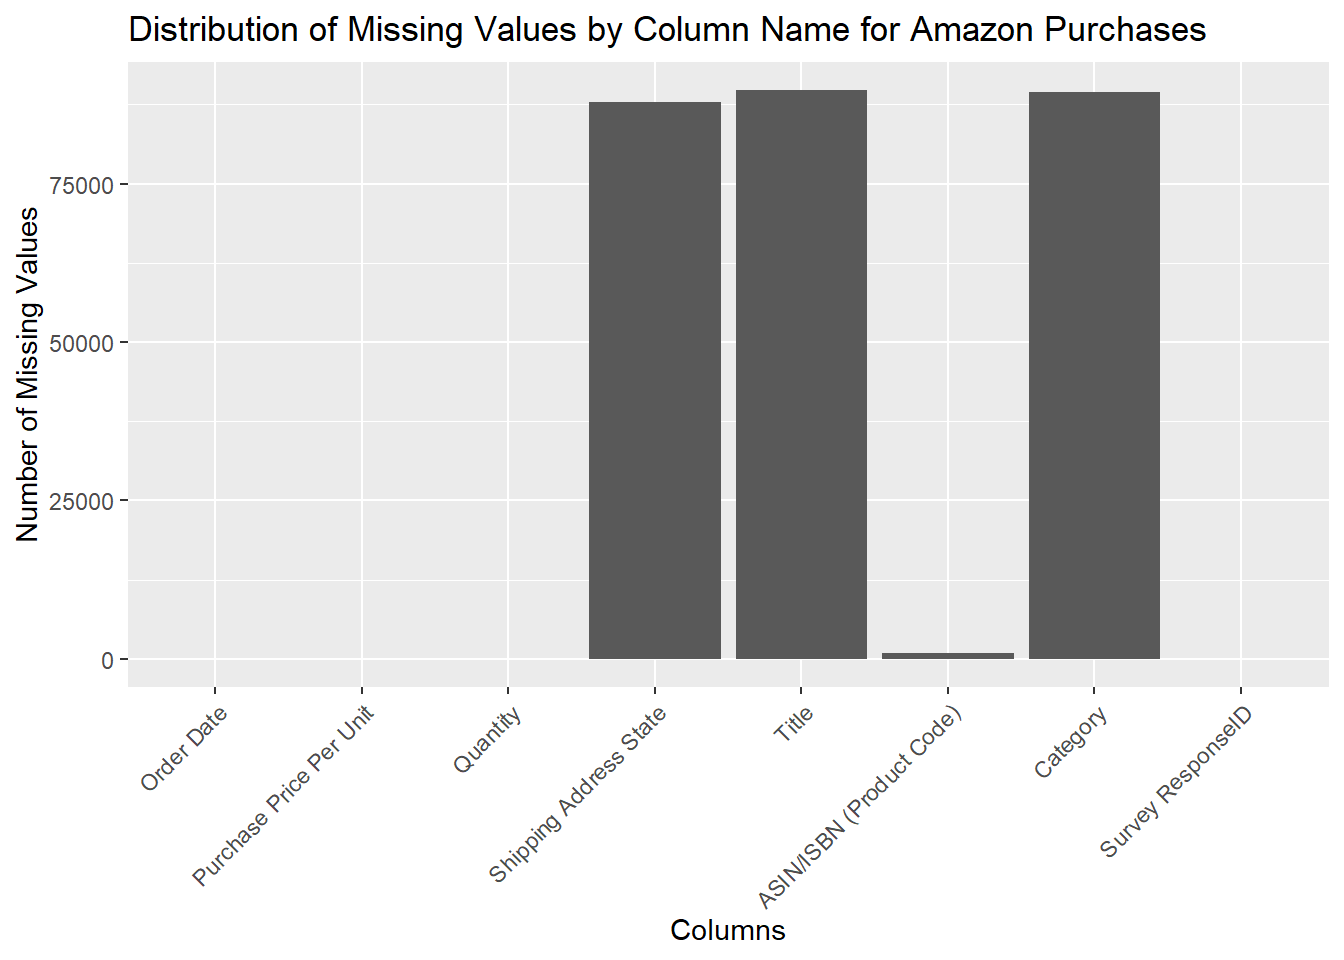
We noticed that shipping address state, title, and category had approximately the same amount of missing values. ASIN/ISBN had a very small amount of missing values, while the rest of the columns had no missing values.
Load in the survey dataset as a dataframe
survey <- read_csv("data/survey.csv")Print out the missing values per column in this dataset
print("Missing values:")[1] "Missing values:"print(colSums(is.na(survey))) Survey ResponseID Q-demos-age
0 0
Q-demos-hispanic Q-demos-race
0 0
Q-demos-education Q-demos-income
0 0
Q-demos-gender Q-sexual-orientation
0 0
Q-demos-state Q-amazon-use-howmany
0 0
Q-amazon-use-hh-size Q-amazon-use-how-oft
0 0
Q-substance-use-cigarettes Q-substance-use-marijuana
0 0
Q-substance-use-alcohol Q-personal-diabetes
0 0
Q-personal-wheelchair Q-life-changes
0 3384
Q-sell-YOUR-data Q-sell-consumer-data
0 0
Q-small-biz-use Q-census-use
0 0
Q-research-society
0 Q-life-changes is the only column that has missing values in this survey dataset. This question is optional, which is why we expected to see this pattern of missing values for only this column.